How bad is inflation?
For the indices below, we compare to December 2019, just before the pandemic.
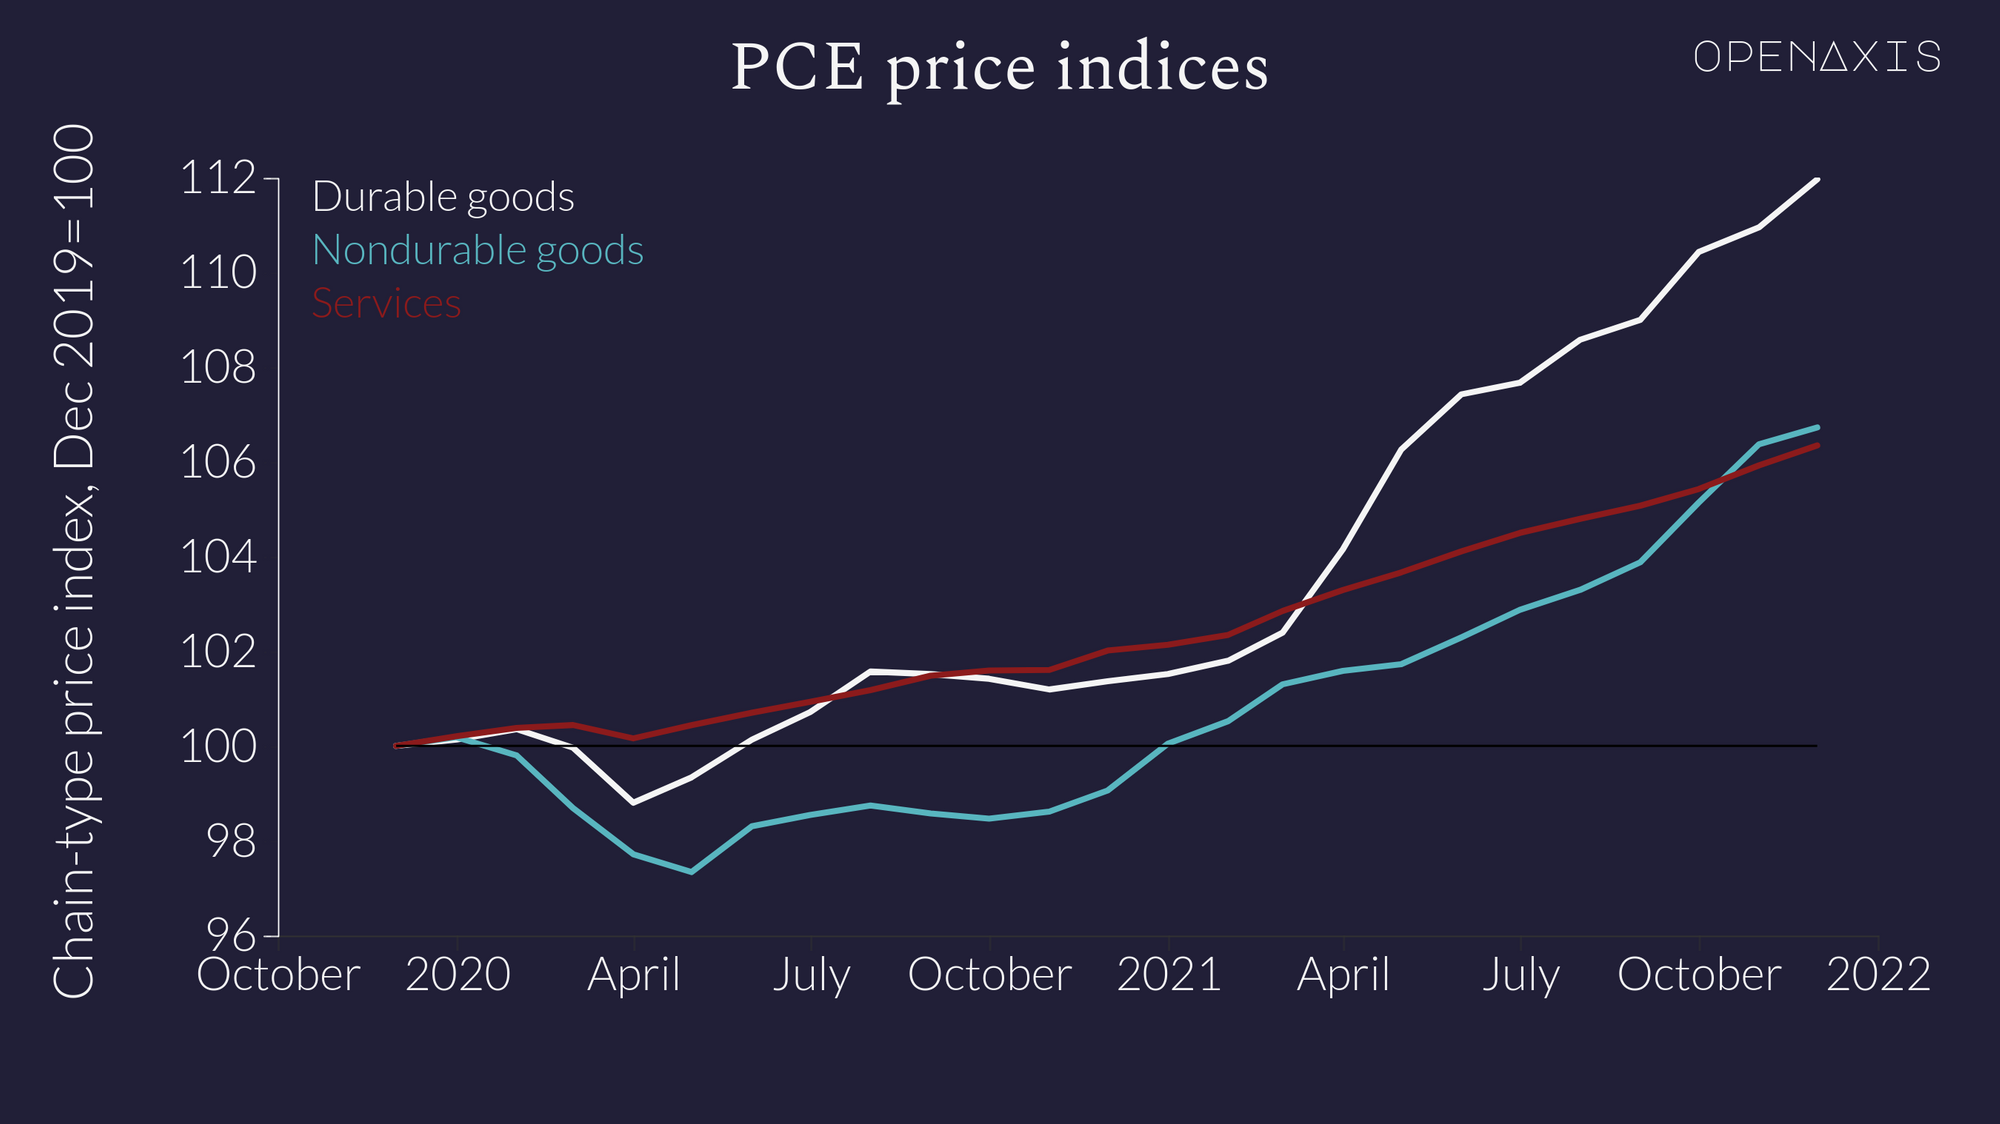
Durable goods cost 12.0% more in December 2021 than they did in December 2019, while non-durable goods and services only cost 6.7 and 6.3 percent more, respectively (as shown above).
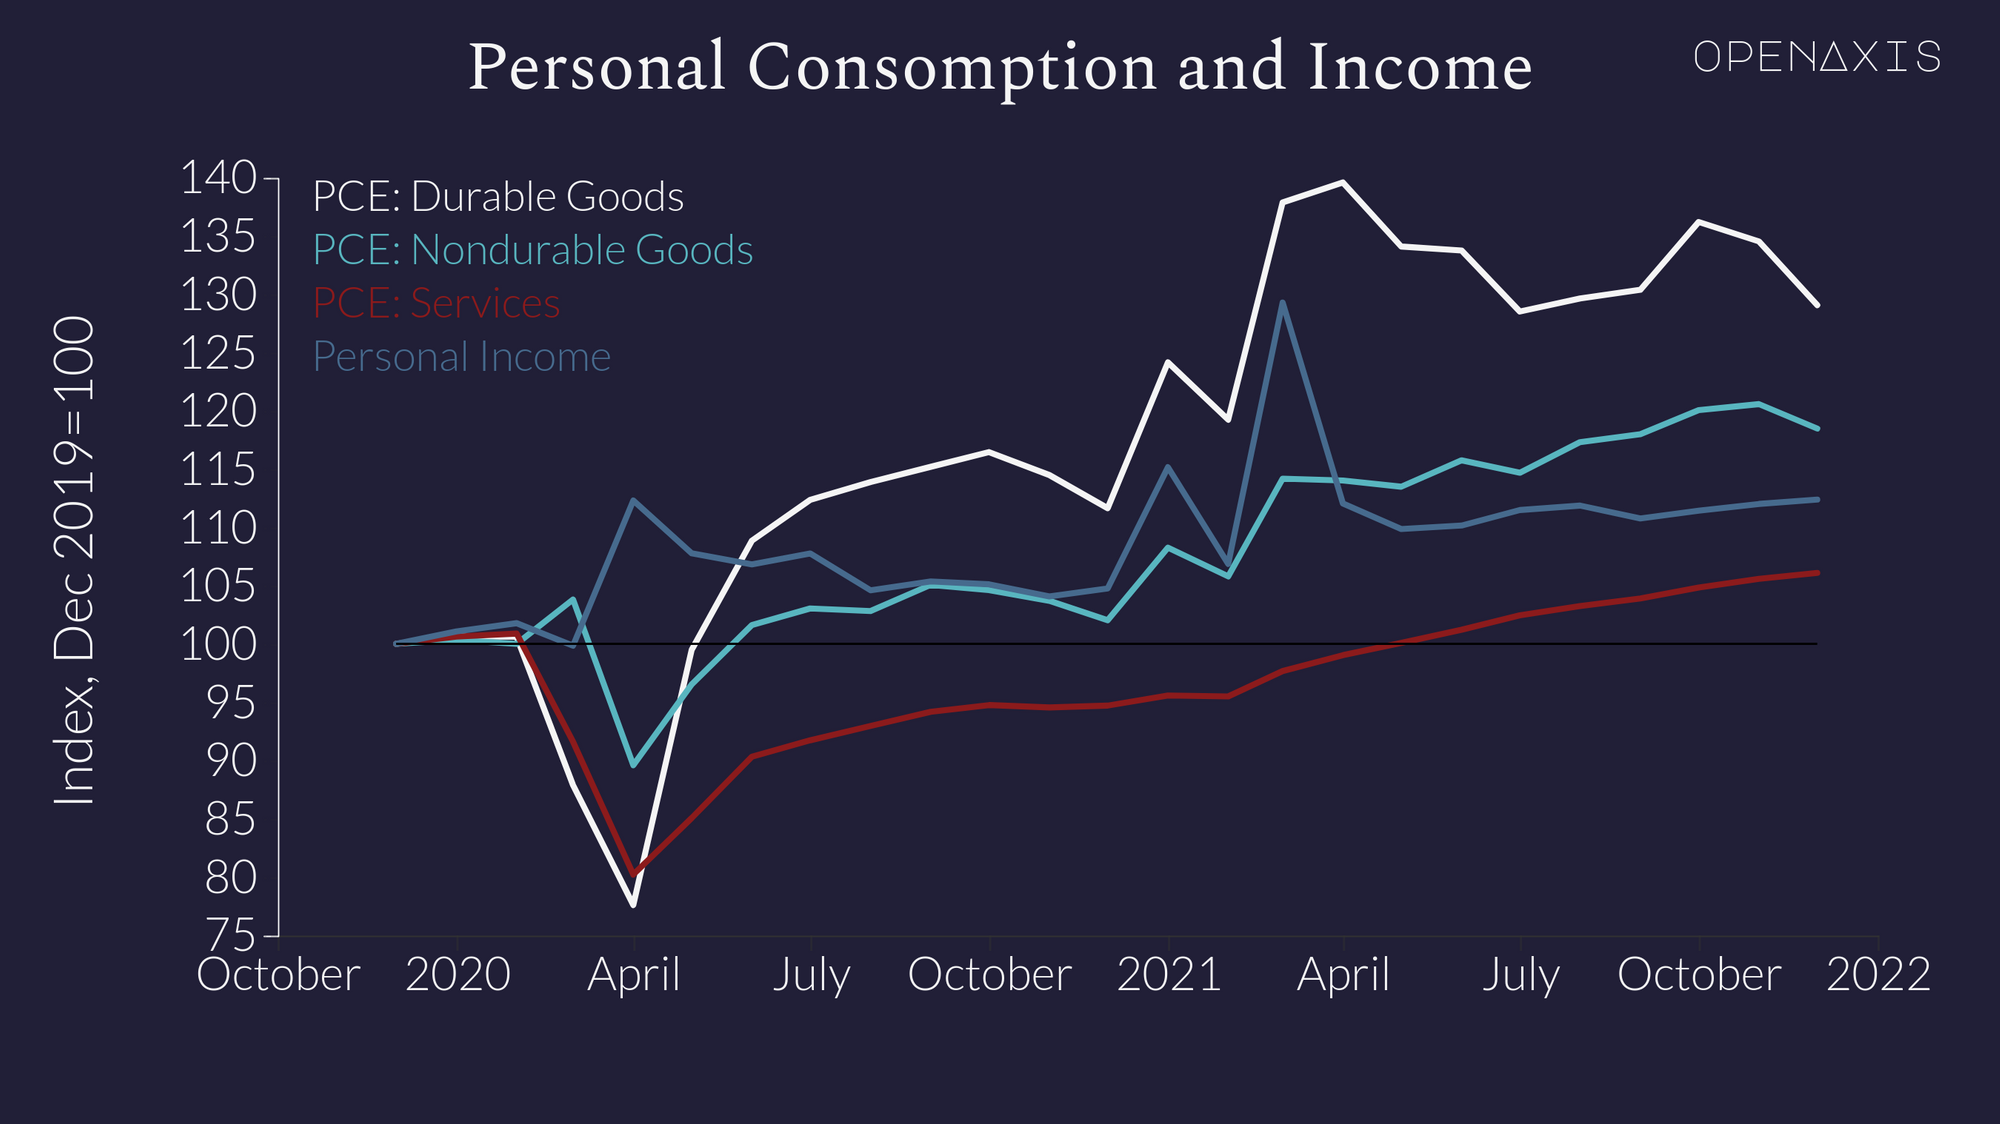
Looking at actual expenditures, consumers spent 29% more on durable goods in December 2021 relative to December 2019 (not only were durables more expensive, but consumers were buying more of them). Expenditure on services didn't grow much though (only 6% over two years) (as shown below).
But... if we think about how much people typically spend on durables relative to other goods we actually see a slightly different story.
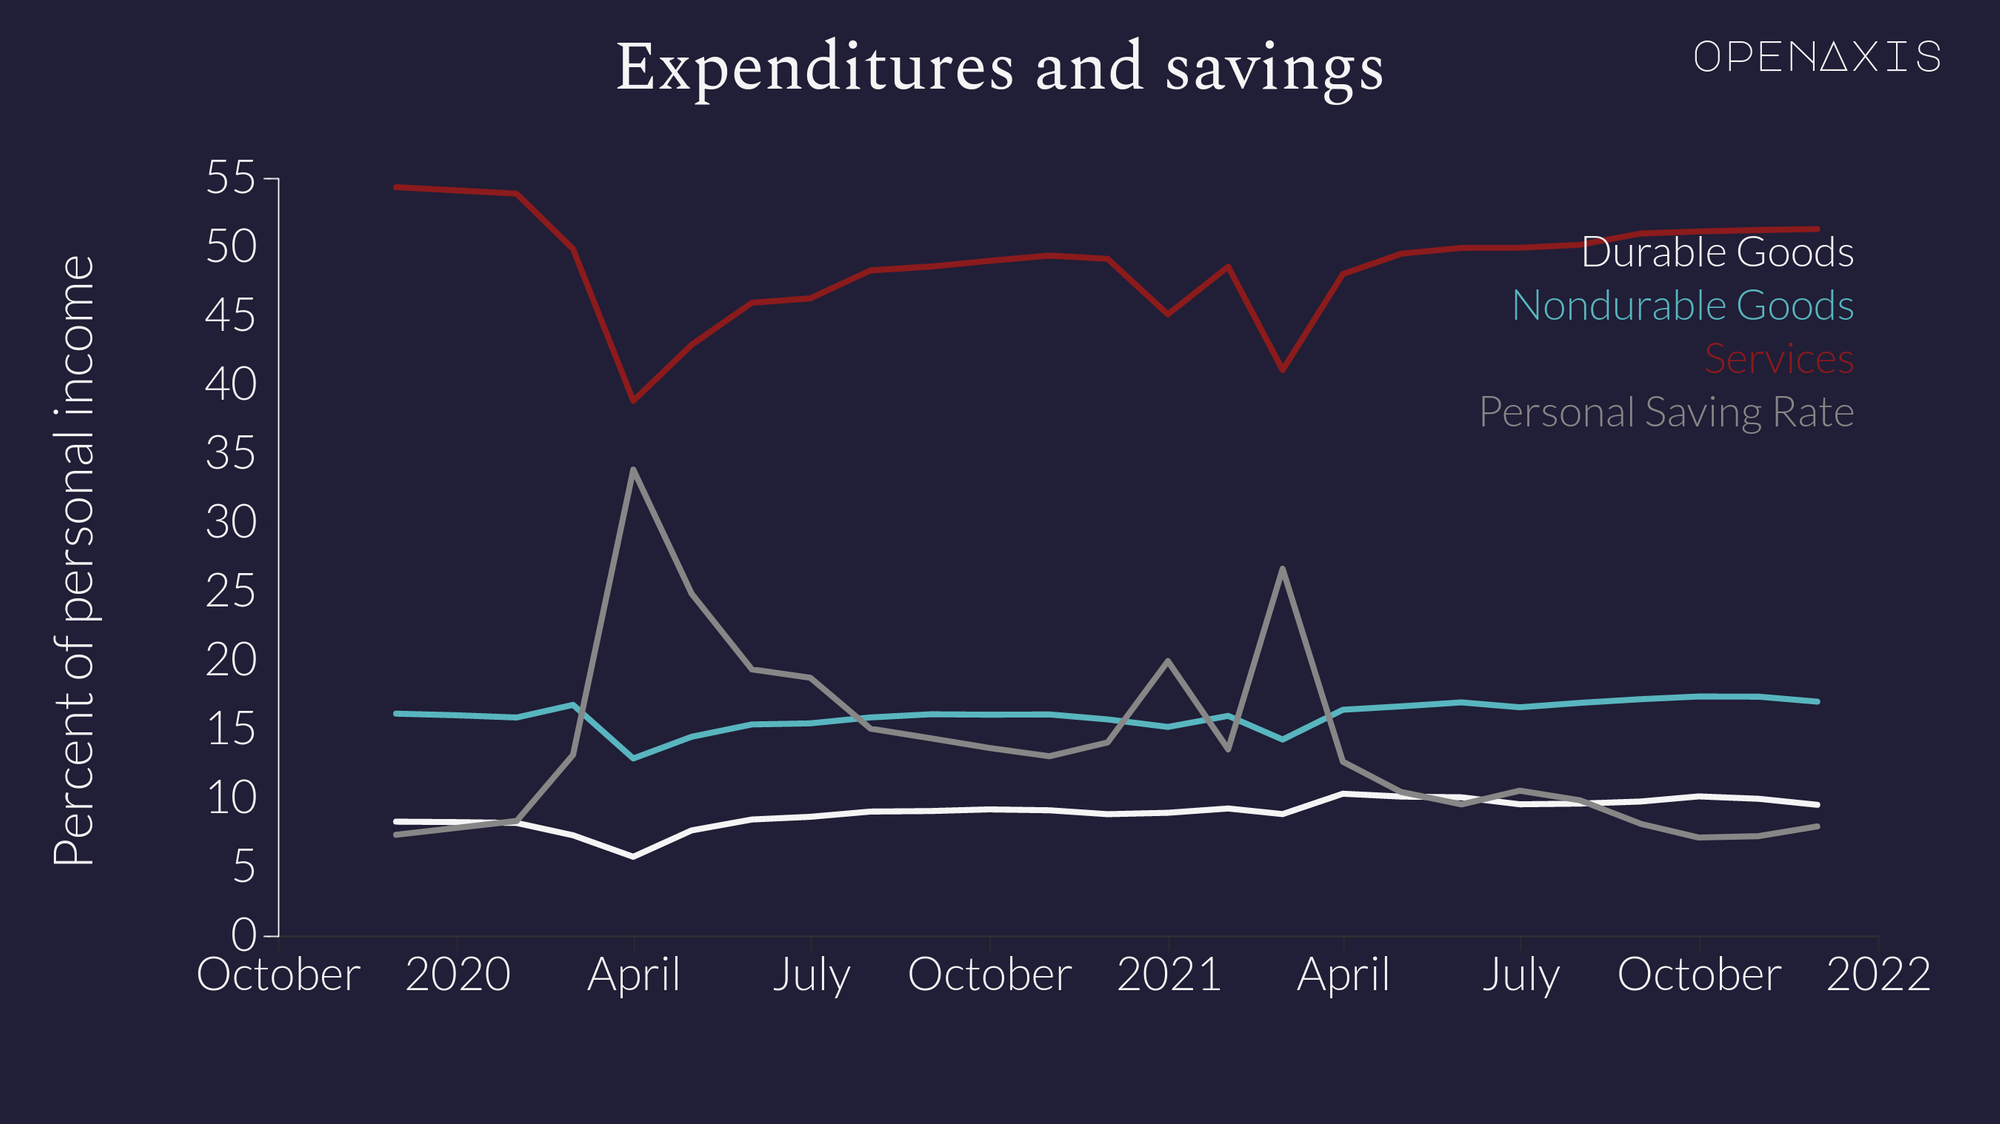
While expenditure on durables grew 29%, personal income grew 12.4%. Again, looking at percentages it looks bad, but expenditure on durables only grew from 8.2% of personal income to 9.5% of personal income.
While that ate into budgets some, the rise in expenditure on services was less than the rise in income - and services are a much larger expenditure (51.3% of income in December 2021) that the personal savings rate actually rose from 7.3 in December 2019 to 7.9% in December 2021.
While inflation on it's surface looks like it would harm consumers, on average it hasn't actually been widespread enough to cut into savings compared to December 2019.